How to SEE Your Sound: A Guide to Audio Spectrograms
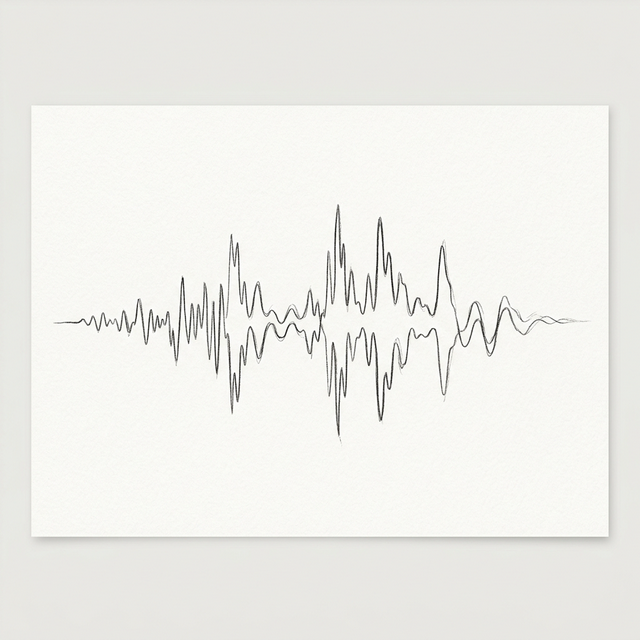
In traditional audio editing, we look at **Waveforms**—the representation of amplitude over time. While useful for seeing where a sound starts and stops, it tells us nothing about the *tone* or the *frequencies* involved. To truly understand audio, you need to use a **Spectrogram**. This 3D visualization adds a third dimension: frequency. In this guide, we’ll explain how to read these "heat maps" of sound and why they are the secret weapon of pro engineers.
The Three Dimensions of Sound
A spectrogram plots time on the X-axis (left to right) and frequency on the Y-axis (bottom to top). The color brightness represents the amplitude (volume) at that specific frequency. Dark colors mean silence, while bright yellows or whites mean intense energy. When you look at a human voice on a spectrogram, you don't just see a squiggly line; you see the fundamental pitch at the bottom and a series of "Harmonics" stacked on top of it. This visual fingerprint is what makes a violin sound different from a piano, even if they play the same note.
Identifying Noise and Artifacts
The real power of the spectrogram is in finding what you *can't* hear easily. For example, a "DC Offset" or "Ground Loop Hum" will show up as a bright, perfectly straight horizontal line at the very bottom (around 50Hz or 60Hz). Digital "clipping" often shows up as a bright red line at the very top. If you are cleaning up an old PCM recording with our tool, the spectrogram is your best friend for identifying where the noise floor begins and where the useful signal ends. You can visually identify clicks (vertical lines) and hiss (general fuzziness across the top) and target them with precision.
The "Brickwall" Effect in Lossy Audio
Want to know if that "high-res" 320kbps MP3 you downloaded is actually a fake converted from a low-quality YouTube rip? Look at the spectrogram. Lossy encoders like MP3 apply a "Brickwall Filter" to save space. A true CD-quality file will show frequency data all the way up to 22kHz. An MP3 converted from a low-bitrate source will often have a hard "cutoff" at 16kHz or even 12kHz, with nothing but black space above it. The spectrogram never lies—it reveals the true heritage of your digital files.
Conclusion
Transitioning from "listening" to "seeing" audio will change how you work forever. It allows for a level of surgical precision that ears alone can't provide. On **audio-converters**, we provide high-resolution visual feedback that helps you understand exactly what’s happening in your PCM data before you commit to an export.