Building a Real-Time Audio Visualizer with HTML5 Canvas
Audio is an invisible medium, but on the web, users expect a visual connection to the sound. Whether it's the bouncing bars of a classic equalizer or the flowing waves of a modern podcast player, visualization improves engagement and provides essential feedback. In this technical guide, we’ll explore how to combine the **Web Audio API** and the **HTML5 Canvas API** to create a high-performance real-time visualizer that runs smoothly at 60 frames per second.
The AnalyserNode: Capturing the Data
The core of any web-based visualizer is the AnalyserNode. This node provides real-time frequency and time-domain analysis information without altering the audio signal. You create it via the AudioContext and connect your source to it. By setting the fftSize (Fast Fourier Transform), you determine the resolution of your data. A larger FFT size provides more detail but requires more CPU power. For most visualizers, a size of 2048 is the "sweet spot," providing 1024 individual frequency bins to work with.
The Animation Loop: requestAnimationFrame
To keep the visualization smooth, you must sync your drawing with the browser's refresh rate. Never use setInterval for animation; instead, use requestAnimationFrame. Inside this loop, you call getByteFrequencyData() on your AnalyserNode. This fills a Uint8Array with values ranging from 0 to 255. These values represent the amplitude of the audio across different frequency ranges—from deep bass on the left to sparkling treble on the right.
Drawing on the Canvas
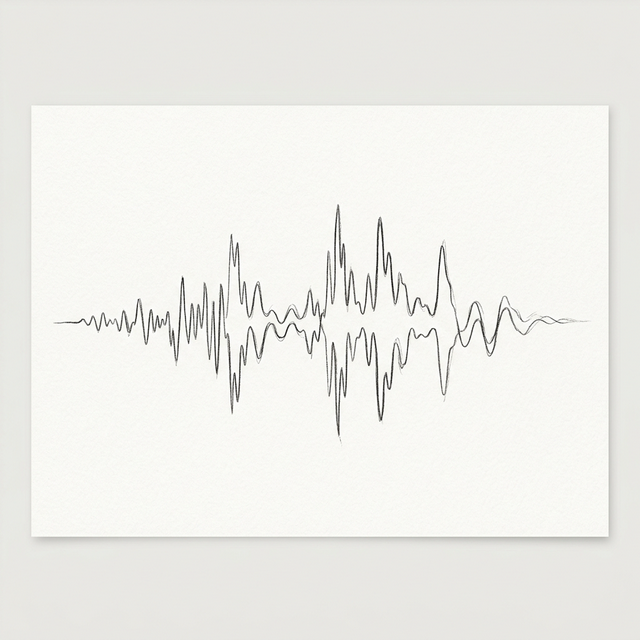
Once you have the array of numbers, the Canvas API becomes your playground. You can iterate through the array and draw rectangles, circles, or complex paths. To create a classic "Bar Visualizer," you simply map the X-position to the array index and the height of the bar to the value in that index. For more artistic effects, you can use gradients, shadows, and opacity to make the visualizer feel "alive." On our **audio-converters** platform, we use a custom-built waveform engine that efficiently renders these data points to provide the responsive feedback you see while recording.
Performance Optimization
Drawing hundreds of bars 60 times a second can be taxing on mobile devices. To optimize, you should avoid creating new objects inside the animation loop. Pre-calculate as much as possible, and use a single beginPath() and stroke() call for the entire visualization rather than individual calls for each bar. If your visualizer is complex, consider using OffscreenCanvas to move the drawing operations to a Web Worker, freeing up the main thread for a stutter-free user experience.
Conclusion
A great visualizer is the bridge between the ear and the eye. By mastering the AnalyserNode and Canvas API, you can transform a simple audio player into a captivating digital experience. Start with the basics, and don't be afraid to experiment with the math—the most beautiful visualizers often come from "happy accidents" in the code.